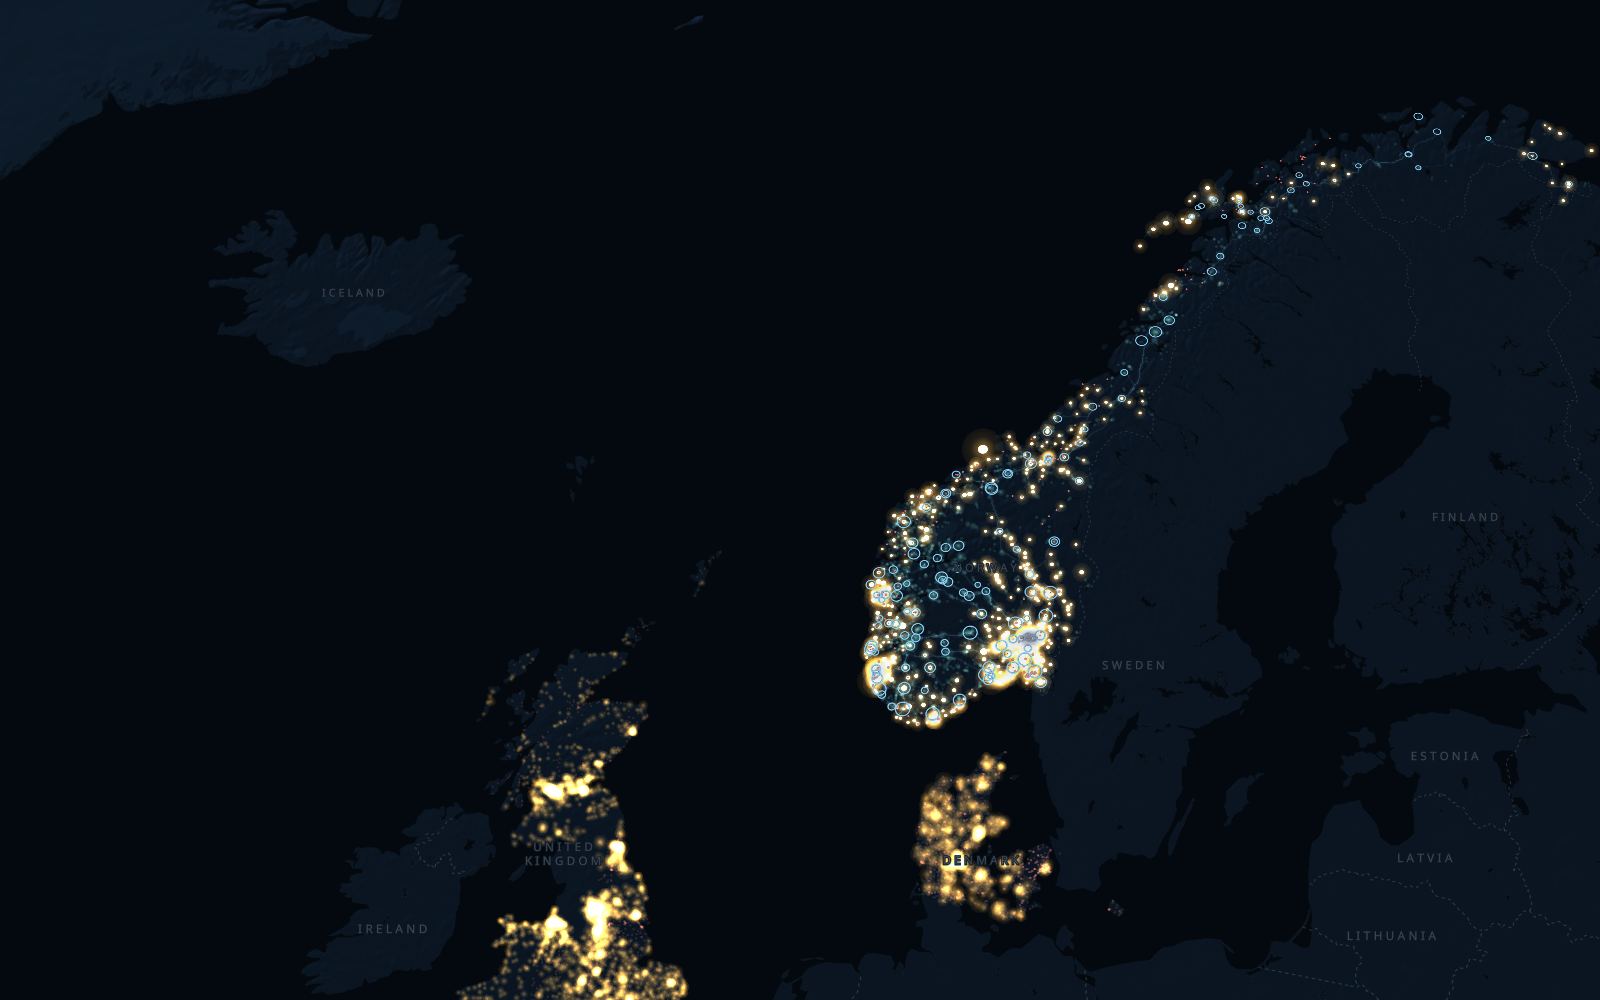
Before a data centre, a factory or a charging depot can connect, the grid needs room for it. Grid operators publish how much is left at each substation, and who is already queuing for it. Substralis puts those figures on one map, with the source one click away.
824 of 864 Norwegian substations publish how much capacity is available for new demand, through WattApp WattApp capacity mapElbits AS for 42 Norwegian DSOsAvailable capacity at DSO substations, for new demand and for new production, as each DSO publishes it. WattApp stamps every figure with the moment it serves it; it publishes no separate effective date.The DSO's figure does not account for capacity in the overlying grid. Statnett's constraints can still bind.Last read—ReadDailyLicenceCC BY-NC-SA 4.0, commercial grantAbout this sourcePublisher ↗. The brighter the light, the more room. Where nothing is published, the map stays dark: we never fill it in.
The grid
Closer in, the grid takes shape.
Transmission and regional lines and transformer stations come from NVE's grid register Grid asset register (Nettanlegg)Norwegian Water Resources and Energy Directorate (NVE)Official geometry of transmission and regional lines, sea cables and transformer stations, with owner and voltage.Last read—ReadWeeklyLicenceNLOD 2.0About this sourcePublisher ↗. Each substation is coloured by what its operator publishes.
Room published
Queue, no room published
Operator says full
Nothing published
Generation
Down to the machinery.
Kvilldal, 1,240 MW, is Norway's largest hydropower plant Hydropower databaseNVEEvery Norwegian hydropower plant in operation: installed MW, owner, gross head, river and year.Installed capacity, not output. A plant's position is its powerhouse.Last read—ReadWeeklyLicenceNLOD 2.0About this sourcePublisher ↗. Its reservoirs, intakes and tunnels are drawn from NVE's hydropower register, and the light moves the way the water does: from intakes up to 830 m above sea level down a 537 m fall to the turbines.
The queue
Then the queue, in place.
Around Rjukan, each column is a case in Statnett's queue Connection queue and reservationsStatnett SFEvery consumption and production case in Statnett's queue: customer, MW, sector, status and dates.Statnett does not publish queue rank or station headroom. Customer names are as registered, without org numbers.Last read—ReadDailyLicenceNLOD 2.0About this sourcePublisher ↗: 6 for new demand, 1,229 MW in all, and 2 for production, 860 MW. Solid columns are reserved; glass columns are still waiting. The largest demand case: Statkraft Energi AS, 900 MW; then Green Mountain AS, 113 MW.
Reserved
Waiting in the queue
Production
The chain
Room is local. The queue is not.
Jeløy, in Moss, publishes 25 MW available for new demand WattApp capacity mapElbits AS for 42 Norwegian DSOsAvailable capacity at DSO substations, for new demand and for new production, as each DSO publishes it. WattApp stamps every figure with the moment it serves it; it publishes no separate effective date.The DSO's figure does not account for capacity in the overlying grid. Statnett's constraints can still bind.Last read—ReadDailyLicenceCC BY-NC-SA 4.0, commercial grantAbout this sourcePublisher ↗. Elvia says it hangs from Tegneby, 10 km away Parent stations (wattapp:parents)Elbits AS for the DSOs in WattAppFor each DSO substation, the Statnett station the DSO says it hangs from. Where a DSO publishes none, Substralis traces NVE's line register, and says so.Last read—ReadDailyLicenceCC BY-NC-SA 4.0, commercial grantAbout this sourcePublisher ↗. At Tegneby, 5 demand cases are waiting for 227 MW, on top of 719 MW already reserved Connection queue and reservationsStatnett SFEvery consumption and production case in Statnett's queue: customer, MW, sector, status and dates.Statnett does not publish queue rank or station headroom. Customer names are as registered, without org numbers.Last read—ReadDailyLicenceNLOD 2.0About this sourcePublisher ↗. Statnett publishes no headroom at Tegneby: the room at Jeløy depends on it all the same.
Gaps
Missing stays missing.
North of the Arctic Circle, 93 of 97 substations publish a figure. A figure that isn't published is shown as not published, never as zero or as free. Every number opens its source: who published it, under what licence, and when we last read it.
Read from the people who run the grid.
Grid operators and regulators publish these figures on their own schedules. Substralis reads each source on a timetable, keeps the date on every figure, and flags a source that stops answering.
WattApp capacity mapElbits AS for 42 Norwegian DSOsAvailable capacity at DSO substations, for new demand and for new production, as each DSO publishes it. WattApp stamps every figure with the moment it serves it; it publishes no separate effective date.The DSO's figure does not account for capacity in the overlying grid. Statnett's constraints can still bind.Last read—ReadDailyLicenceCC BY-NC-SA 4.0, commercial grantAbout this sourcePublisher ↗
WattApp capacity map
Elbits AS for 42 Norwegian DSOs
Available capacity at DSO substations, for new demand and for new production, as each DSO publishes it. WattApp stamps every figure with the moment it serves it; it publishes no separate effective date.
Connection queue and reservationsStatnett SFEvery consumption and production case in Statnett's queue: customer, MW, sector, status and dates.Statnett does not publish queue rank or station headroom. Customer names are as registered, without org numbers.Last read—ReadDailyLicenceNLOD 2.0About this sourcePublisher ↗
Connection queue and reservations
Statnett SF
Every consumption and production case in Statnett's queue: customer, MW, sector, status and dates.
Grid asset register (Nettanlegg)Norwegian Water Resources and Energy Directorate (NVE)Official geometry of transmission and regional lines, sea cables and transformer stations, with owner and voltage.Last read—ReadWeeklyLicenceNLOD 2.0About this sourcePublisher ↗
Grid asset register (Nettanlegg)
Norwegian Water Resources and Energy Directorate (NVE)
Official geometry of transmission and regional lines, sea cables and transformer stations, with owner and voltage.
Hydropower databaseNVEEvery Norwegian hydropower plant in operation: installed MW, owner, gross head, river and year.Installed capacity, not output. A plant's position is its powerhouse.Last read—ReadWeeklyLicenceNLOD 2.0About this sourcePublisher ↗
Hydropower database
NVE
Every Norwegian hydropower plant in operation: installed MW, owner, gross head, river and year.
KapacitetskortEnerginet and Danish DSOsAvailable capacity at Danish substations.Last read—ReadWeeklyLicencePublicAbout this sourcePublisher ↗
Kapacitetskort
Energinet and Danish DSOs
Available capacity at Danish substations.
LTDS heatmapsThe GB distribution network operator named on each stationHeadroom at GB primary and bulk supply points, from each DNO's Long Term Development Statement.Some operators publish MVA, not MW; units are kept as published and never compared across units.Last read—ReadPer operatorLicencePer operator, see the operator's data portalAbout this sourcePublisher ↗
LTDS heatmaps
The GB distribution network operator named on each station
Headroom at GB primary and bulk supply points, from each DNO's Long Term Development Statement.
Each market publishes something different, and each keeps its own unit and grain. Norway, Denmark, Sweden and Britain are open to everyone; Finland, the Netherlands, Germany, Ireland and France are in the signed-in portal.
NorwayHeadroom at substations, and every case in Statnett's queue824 stations with a figure
DenmarkHeadroom at substations1,276 stations with a figure
SwedenCounty capacity to 2035, and connection bands at stations21 counties
FinlandHeadroom at substations, and main-grid capacity by yearSigned in
Great BritainHeadroom at substations, and the connection registers4,211 stations with a figure
NetherlandsOfftake status per feeding areaSigned in
GermanyForward connection bands at transmission stationsSigned in
IrelandHeadroom at distribution nodes, in MVASigned in
FranceOfftake capacity per RTE consumption zoneSigned in
The whole map is in the portal.
Signed in, you get all nine markets, every station's dossier with the station it depends on and the queue there, memos you can share, and alerts when a figure changes. There are no tiers.