Markets · NL
The Netherlands
The Dutch grid operators state, per feeding area, whether there is room for new offtake and how many requests are waiting.
- What is published
- Offtake status per feeding area
- Sources read
- 6
- Last read
- 25 September 2026
Live map
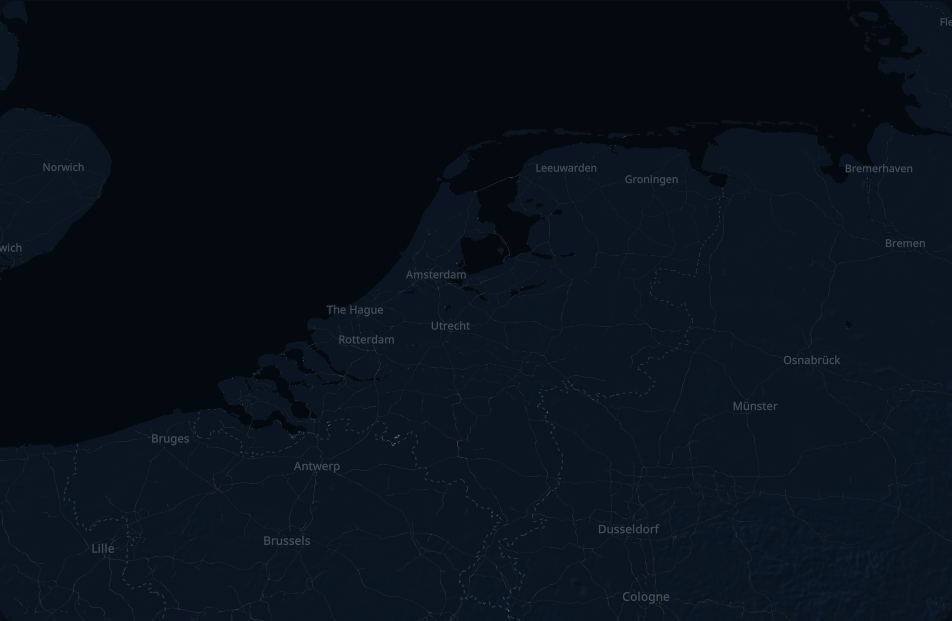
The Netherlands' figures are in the signed-in portal. The sources behind them are listed below.
The map shows the grid's setting; figures appear once you sign in.Figures as read 25 September 2026
What the Netherlands publishes
- Offtake status per feeding area (available, limited or short) and the number of requests waiting (Netbeheer Nederland capacity map)
- TenneT's published capacity outlook, and subsidised projects from the RVO register
What it doesn't
- MW per station: the status is stated per area
- Coordinates in the per-station roster, so stations are shown by area
Sources
ENTSO-E Transparency Platform
Hourly bidding-zone telemetry across 14 European countries: prices, actual load, generation by type, imbalance pricesNetbeheer Nederland (TenneT + regional network operators)
Per feeding-area (voedingsgebied) offtake/load-side connection-availability status across the Dutch gridPartners in Energie / Netbeheer Nederland
Named TenneT substations with traffic-light status, beyond aggregate Dutch grid areasRijksdienst voor Ondernemend Nederland (RVO)
Named applicants and project sites from the Dutch SDE subsidy registerTenneT / Netbeheer Nederland
Daily Dutch grid-area disclosures of hosting capacity, request counts, and queued MWTenneT Netherlands
Hourly Dutch balancing-market series: balance-delta detail, merit-order threshold curves, and settlement prices